
Meaning and mechanism
The growth model assumes that the per capita growth rate, denoted as ‘r’, is constant. Even if the population increases at the same rate, the total increase in population over the same period will become larger.
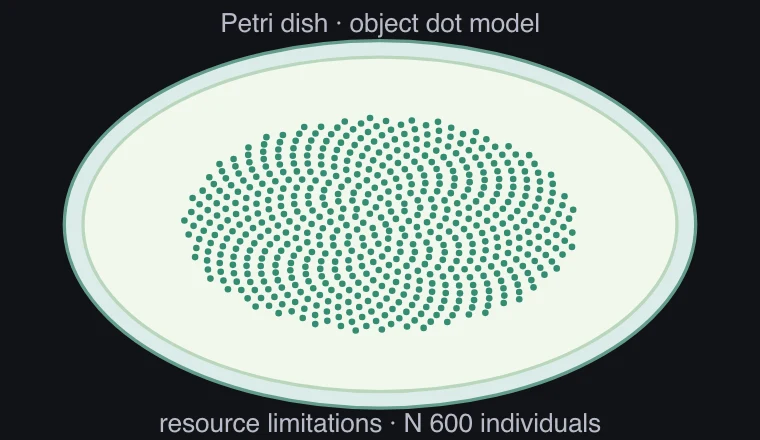
In a logistic model, as the population size approaches the environment's carrying capacity [K], the rate of per capita increase decreases. Resource limitation is represented as a simple dependence on population density.
Relationships and conditions
The index model is dN/dt=rN, and the logistic model is dN/dt=rN(1−N/K). In the logistic model, the absolute growth rate is largest near N=K/2.
The actual K value can vary depending on the season, habitat, and generation. The defined K value for a model is a reference point, assuming a constant environment, and is not the permanent maximum population.
What to observe in the simulation
In the logistic model, the increase rate per individual decreases as N increases. Read the time curve and the growth rate according to N together.
It is an analysis formula for the number of consecutive populations in a closed group with a constant r·K. The calculated value may not be an integer. We omit the contingencies of birth and death, immigration and exodus, age structure, delayed resource effects, and actual species-specific figures. The conversion value of one point is fixed for each condition and only a maximum of 1200 points are drawn.
Key relationships and symbols
N index=N₀eʳᵗ · Nlogistic=K/[1+(K/N₀−1)e⁻ʳᵗ]
| Symbol | Meaning | Unit |
|---|---|---|
| N | Population size | individuals |
| r | Per capita net growth rate | Time⁻¹ |
| K | Carrying capacity | individuals |
Worked example
Which N has the largest growth rate in the logistic model?
dN/dt=rN(1−N/K) is an open downward quadratic for N. It is maximum at N=K/2 and 0 at N=K.
Common misconceptions
- The state where the logistic model’s increase is fastest is not when it has completely reached K.